
Are consumers still swiping cards in person? Are they shopping more online? And which tools and hardware do businesses rely on to keep up? In this article, we break down the latest payment trends and statistics based on real transaction data across industries. From the most used payment methods to the tools powering online and in-person checkouts.
Are people more likely to buy in-store or online?
According to our data, in-person shopping still leads overall, with 68.10% of transactions are card-present (face-to-face), compared to 31.90% online. But the picture changes dramatically depending on the industry.
Take away: Where and how people buy depends heavily on what you sell. If you're in food, hospitality, or personal care, being equipped for smooth in-person payment is still critical. However, if you’re in software, consulting, or any remote-first industry, online is your main channel.
| Industry Market | In-person | Online |
|---|---|---|
| Restaurant | 96.95% | 3.05% |
| Gas Stations | 96.62% | 3.38% |
| Health Beautyand Wellness | 87.50% | 12.50% |
| Retail Goods | 83.49% | 16.51% |
| Recreation | 78.71% | 21.29% |
| Charity Non Profit | 62.99% | 37.01% |
| Healthcare | 61.98% | 38.02% |
| Automotive | 58.81% | 41.19% |
| HotelsLodging | 56.32% | 43.68% |
| Wholesale | 50.74% | 49.26% |
| CabDelivery | 41.12% | 58.88% |
| ContractorsHome Services | 37.16% | 62.84% |
| Transportation | 36.82% | 63.18% |
| ProfessionalServices | 29.70% | 70.30% |
| Education | 29.68% | 70.32% |
| Organizationsand Associations | 28.09% | 71.91% |
| Platforms Appsand SaaS | 11.33% | 88.67% |
| EnterpriseUtilities | 9.43% | 90.57% |
For industries rooted in physical experiences (like dining, fueling up, or personal care) in-store transactions are overwhelmingly dominant. For example, restaurants see 96.95% of transactions happen in person. Gas stations follow closely at 96.62%. These are industries where speed, service, and immediacy matter—things that can’t be easily replicated online.
For businesses where there’s no physical storefront—or where services are booked, billed, or delivered digitally—online transactions now lead the way. Platforms, Apps, and SaaS companies process 88.67% of their transactions online. Enterprise Utilities and Professional Services follow closely at 90.57% and 70.30%, respectively.
Some industries are right in the middle of this shift. Wholesale sees a nearly even split between in-person (50.74%) and online (49.26%) transactions. Automotive businesses are also surprisingly close to the middle—41.19% of payments happen online, possibly reflecting vehicle deposits, service bookings, or parts sales.
What are the most popular payment methods in the U.S. and Canada?
The op payment methods used across industries in the U.S. and Canada are:
- Credit cards: 83.12% of total transactions
- Debit cards: 15.47% of total transactions
- ACH/EFT: 1.40% of total transactions
Below is a detailed breakdown of the adoption rate of each payment method across different industries:
| Industry | ACH/EFT | Credit card | Debit card |
|---|---|---|---|
| Enterprise Utilities | 0.93% | 97.45% | 1.62% |
| Healthcare | 1.21% | 91.41% | 7.38% |
| Professional Services | 4.35% | 90.13% | 5.52% |
| Automotive | 1.07% | 89.92% | 9.01% |
| Platforms Appsand SaaS | 8.72% | 89.89% | 1.39% |
| Education | 3.43% | 89.53% | 7.05% |
| Wholesale | 1.69% | 87.95% | 10.35% |
| Contractors &Home Services | 5.66% | 85.62% | 8.72% |
| Hotels Lodging | 4.16% | 83.74% | 12.10% |
| Retail Goods | 0.40% | 83.53% | 16.08% |
| Organizationsand Associations | 7.18% | 83.33% | 9.50% |
| Charity &Non Profit | 1.16% | 81.73% | 17.11% |
| Health Beautyand Wellness | 1.07% | 80.58% | 18.35% |
| Recreation | 0.97% | 73.16% | 25.87% |
| Restaurant | 0.04% | 68.33% | 31.63% |
| Overall | 1.40% | 83.12% | 15.47% |
Which industries rely on credit cards the most?
Credit cards are the go-to payment method across nearly every industry. In many cases, more than 80–90% of all transactions are done using credit cards. Here are the top industries that rely the most on credit card transactions in the U.S. and Canada:
- Enterprise & Utilities: 97.45%
- Healthcare: 91.41%
- Professional Services: 90.13%
- Automotive: 89.92%
- Platforms, Apps, and SaaS: 89.89%
- Education: 89.53%
These numbers show just how critical it is to offer credit card payments—especially in B2B or service-heavy industries. Without it, you risk turning away the majority of your customers.
Which industries see the highest debit card usage?
While credit cards lead overall, some industries see higher debit card usage—especially those where customers are more likely to pay with their own funds rather than on credit. The industries that accept debit card payments the most in the U.S. and Canada are:
- Restaurant: 31.63%
- Recreation: 25.87%
- Health, Beauty, and Wellness: 18.35%
- Charity and Non-Profit: 17.11%
- Retail Goods: 16.08%
If you're in one of these industries, offering a smooth debit card payment experience matters. It’s often a dealbreaker for your customers—especially for day-to-day or lower-cost transactions.
Which industries accept ACH/EFT payments the most?
ACH or EFT payments let you accept bank-to-bank payments. This payment method is common for sectors that handle memberships, donations, or larger invoices. The industries that accept ACH payments the most in the U.S. and Canada are:
- Organizations and Associations: 7.18%
- Contractors and Home Services: 5.66%
- Professional Services: 4.35%
- Education: 3.43%
- Platforms, Apps, and SaaS: 2.72%
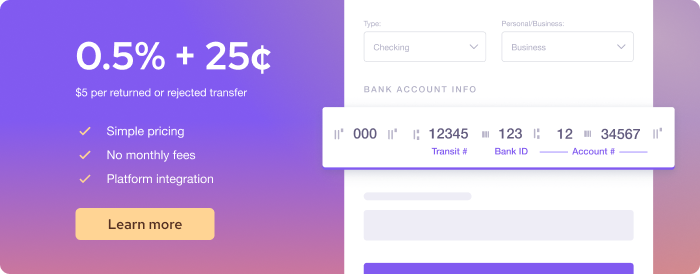
ACH is slower but cheaper to process compared to credit cards, making it ideal for recurring payments or larger sums. For example, Helcim charges 0.5% + 25¢ for ACH/EFT payments, and the fees are capped at $6 for transactions below $25,000.
If you're in these industries, setting up ACH payments could help reduce your payment processing fees and appeal to clients who prefer bank transfers.
What are the popular tools to accept online payments?
The most popular tools to accept online payments are:
- Virtual terminal: 62.55% of total transactions
- Recurring payments: 14.83% of total transactions
- Invoicing software: 11.50% of total transactions
- Payment pages: 9.61% of total transactions
- Online storefront builder: 1.50% of total transactions
Below is a detailed breakdown of the percentage of total online transactions processed using each tool by industry.
| Industry Market | Invoicing | Onlinestorefrontbuilder | Payment Pages | RecurringPayments | VirtualTerminal |
|---|---|---|---|---|---|
| Contractors &Home Services | 27.64% | 0.00% | 12.19% | 3.08% | 57.10% |
| Retail Goods | 22.12% | 0.40% | 4.00% | 2.03% | 71.44% |
| Hotels Lodging | 19.09% | 4.84% | 13.42% | 7.25% | 55.39% |
| Professional Services | 14.45% | 1.30% | 11.76% | 23.49% | 49.01% |
| Wholesale | 13.00% | 0.38% | 4.81% | 8.93% | 72.89% |
| Transportation | 12.38% | 0.01% | 1.92% | 0.16% | 85.53% |
| Recreation | 10.89% | 3.55% | 24.93% | 18.88% | 41.74% |
| Health Beauty andWellness | 8.32% | 0.54% | 4.85% | 63.68% | 22.62% |
| Platforms Appsand SaaS | 8.32% | 0.00% | 6.75% | 37.96% | 46.98% |
| Cab Delivery | 6.98% | 0.00% | 3.90% | 12.12% | 76.99% |
| Healthcare | 6.15% | 0.04% | 5.00% | 10.43% | 78.38% |
| Automotive | 6.00% | 0.00% | 3.13% | 11.93% | 78.94% |
| Organizations andAssociations | 5.94% | 2.50% | 13.15% | 55.71% | 22.71% |
| Education | 5.03% | 1.67% | 38.14% | 25.35% | 29.80% |
| Enterprise Utilities | 4.47% | 0.05% | 28.46% | 10.60% | 56.41% |
| Restaurant | 3.56% | 29.89% | 1.03% | 0.38% | 65.15% |
| Charity & Non Profit | 1.84% | 2.25% | 26.51% | 40.21% | 29.19% |
| Overall | 11.50% | 1.50% | 9.61% | 14.83% | 62.55% |
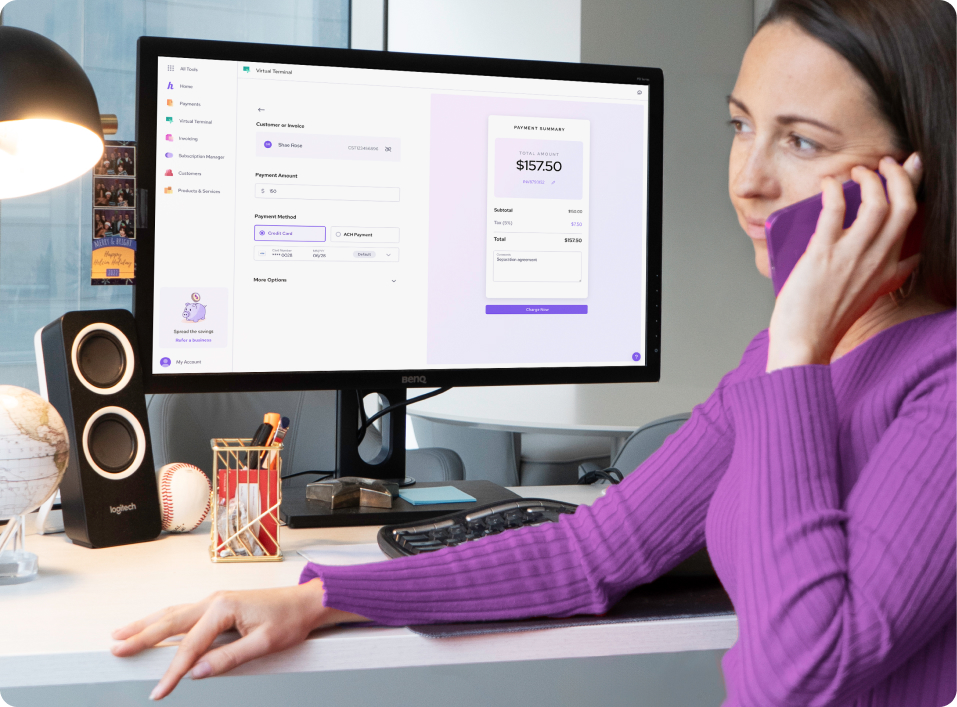
Virtual terminals help you enter the payment details and charge the customers using your laptop.
If you accept payments over the phone, or handle bookings, service calls, or scheduled appointments, this tool is hard to beat. Transportation leads the way, with 85.54% of online transactions are accepted using virtual terminals.
Recurring payment processing is primarily for businesses that bill regularly—like memberships, subscriptions, or payment plans. Health, Beauty, and Wellness leads with 63.68% of its transactions processed through recurring billing. Automating payments not only saves time but also helps maintain steady cash flow.

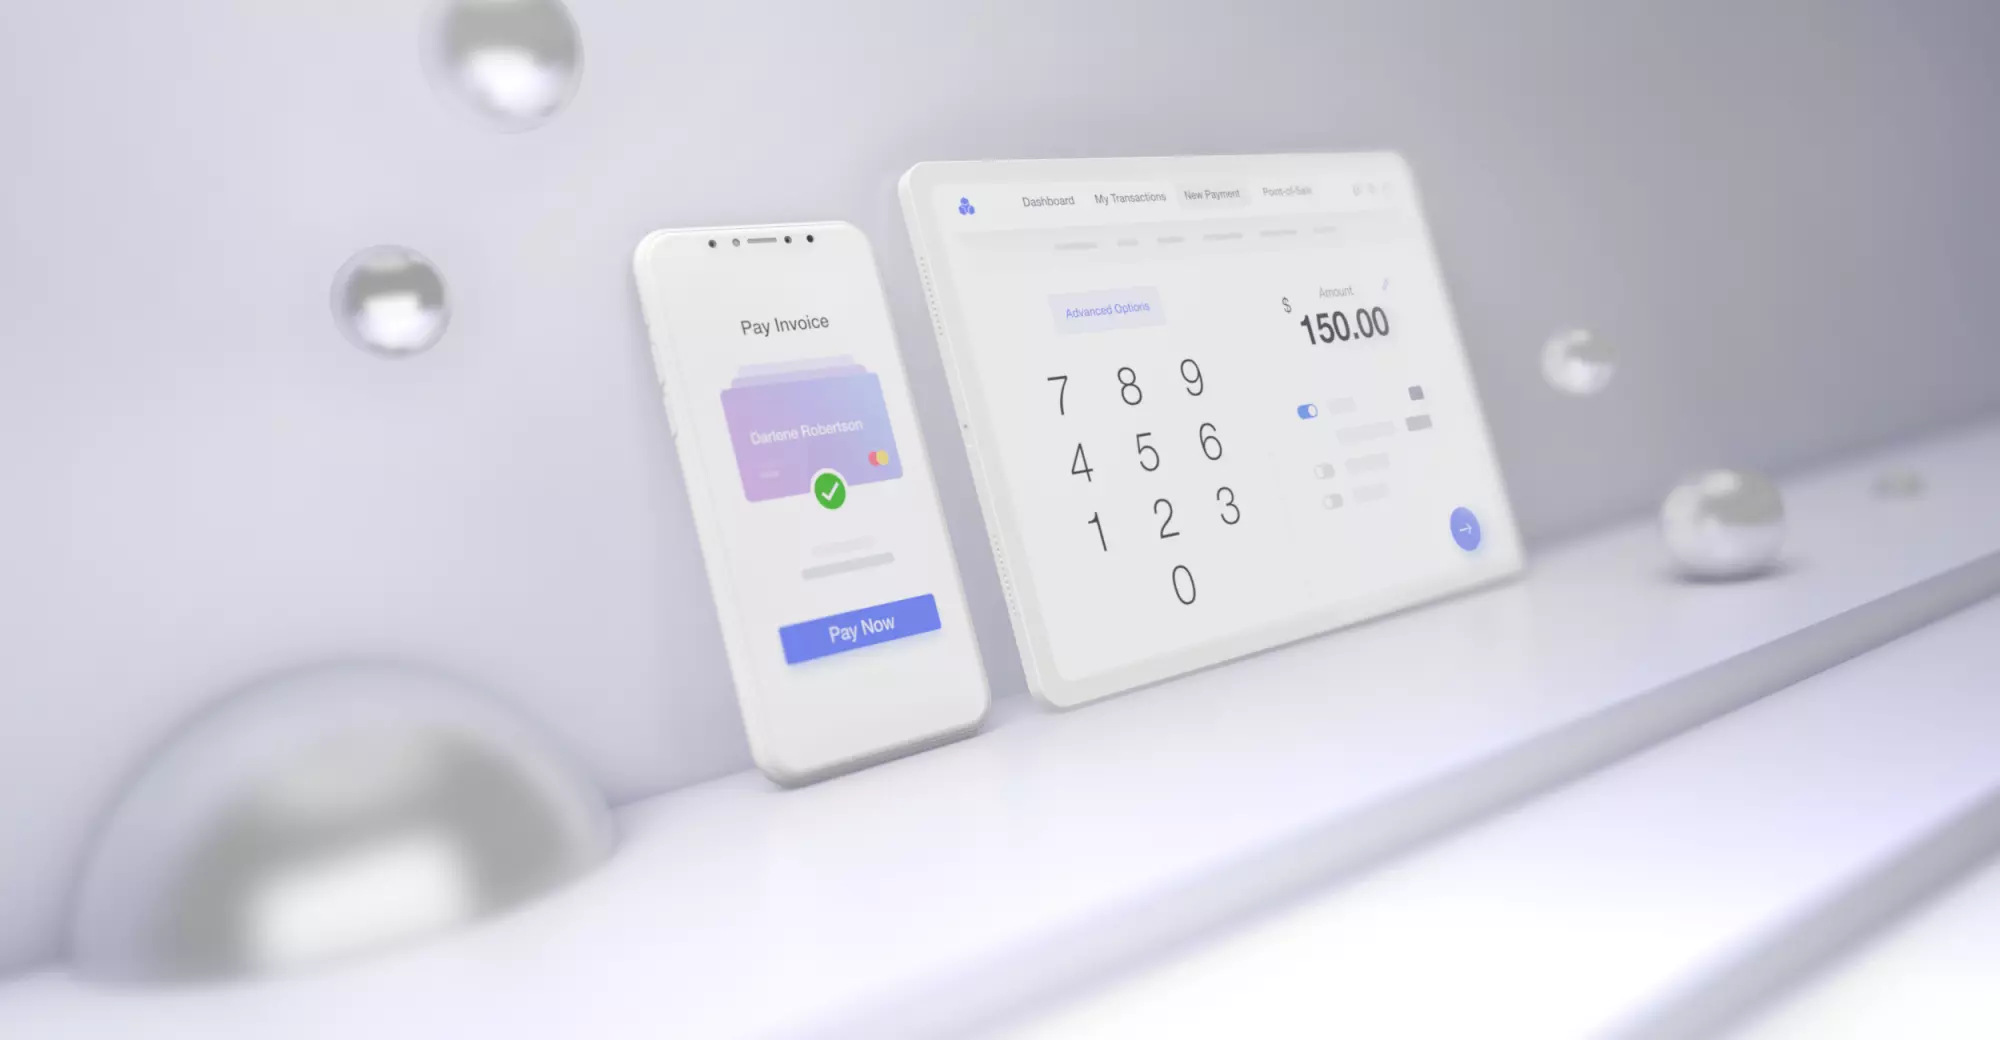
Hosted Payment Pages lets you add a checkout button to your website, with no programming required. They’re quick to set up, easy to share, and great for collecting one-time or donation-based payments. The payment pages are popular in Education (38.14% of transactions), Enterprise Utilities (28.46%), Charity and Non-Profit (26.51%), and Recreation (24.93%).

Online invoicing remains widely used in industries where services are delivered first and payment comes later. Contractors and Home Services process 27.64% of their transactions through invoicing, followed by Retail Goods (22.12%), Hotels and Lodging (19.09%), and Professional Services (14.45%).

Online storefront builders let you build a quick online store to accept online orders. They are gaining traction in the restaurant space. Restaurants process 29.89% of their transactions through this tool.
What is the most popular hardware that accepts in-person payments?
The most popular hardware to accept in-person payments are:
- Card reader: 37.30% of total transactions
- Smart terminal: 62.70% of total transactions
| Industry Market | Card Reader | Smart Terminal |
|---|---|---|
| Restaurant | 16.50% | 83.50% |
| Health Beauty and Wellness | 28.10% | 71.90% |
| Recreation | 29.25% | 70.75% |
| Cab Delivery | 35.53% | 64.47% |
| Education | 36.20% | 63.80% |
| Automotive | 41.52% | 58.48% |
| Wholesale | 41.91% | 58.09% |
| Hotels Lodging | 43.45% | 56.55% |
| Retail Goods | 44.75% | 55.25% |
| Contractors & Home Services | 50.11% | 49.89% |
| Charity & Non Profit | 53.54% | 46.46% |
| Healthcare | 54.54% | 45.46% |
| Professional Services | 55.71% | 44.29% |
| Organizations and Associations | 67.07% | 32.93% |
| Enterprise Utilities | 85.62% | 14.38% |
| Platforms Apps and SaaS | 89.84% | 10.16% |
| Transportation | 99.09% | 0.91% |
| Overall | 37.30% | 62.70% |
Smart terminals let you accept cards and contactless payments, print receipts, check inventory, and manage orders—all from a single device. They're especially popular in industries where staff need a reliable and sleek device for customer-facing payments. Restaurants lead the way, with 83.37% of in-person transactions processed through smart terminals, followed by Health, Beauty, and Wellness (71.45%) and Recreation (70.68%).
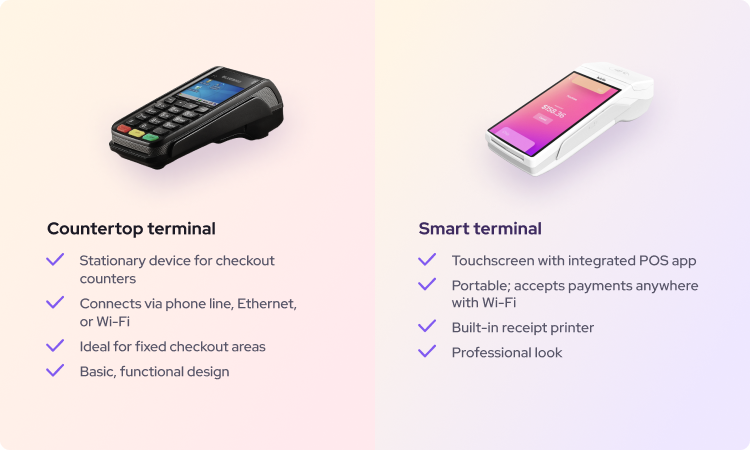
Credit card readers are smaller than smart terminals and can accept card payments and digital wallets through tap or insert. But unlike smart terminals, they can't print receipts or manage inventory. These compact devices are ideal for businesses that need mobility or want to pair payments with phones, tablets, or desktops. Transportation sees the highest usage at 94.87%, followed by Platforms and SaaS (88.20%) and Enterprise Utilities (85.35%). If you're often on the move or working in the field, a card reader is a flexible, lightweight solution.
If you don’t want to carry around a clunky credit card machine, you can use Tap to Pay on iPhone to accept payments directly from your iPhone—no extra hardware needed.
What are the popular payment integration options for businesses?
The most common payment integration options for businesses are:
- Payment API: 85.97% of businesses
- eCommerce integration: 10.73% of businesses
- Accounting integration: 3.30% of businesses
The table below shows how widely each payment integration option is used across industries.
| Industry Market | Payment API | eCommerceIntegration | Accountingintegration | RecurringPayments | VirtualTerminal |
|---|---|---|---|---|---|
| Automotive | 78.67% | 21.13% | 0.20% | 3.08% | 57.10% |
| Cab Delivery | 99.43% | 0.28% | 0.28% | 2.03% | 71.44% |
| Charity &Non Profit | 77.81% | 21.85% | 0.34% | 7.25% | 55.39% |
| Contractors &Home Services | 26.07% | 42.82% | 31.10% | 23.49% | 49.01% |
| Education | 95.42% | 4.47% | 0.11% | 8.93% | 72.89% |
| Enterprise Utilities | 99.92% | 0.07% | 0.01% | 0.16% | 85.53% |
| Health Beautyand Wellness | 97.13% | 0.49% | 2.38% | 18.88% | 41.74% |
| Healthcare | 89.47% | 5.09% | 5.44% | 63.68% | 22.62% |
| Hotels Lodging | 93.09% | 2.97% | 3.95% | 37.96% | 46.98% |
| Organizationsand Associations | 81.96% | 4.99% | 13.05% | 12.12% | 76.99% |
| Platforms Appsand SaaS | 93.54% | 0.19% | 6.27% | 10.43% | 78.38% |
| ProfessionalServices | 93.67% | 2.33% | 4.00% | 11.93% | 78.94% |
| Recreation | 89.87% | 10.12% | 0.01% | 55.71% | 22.71% |
| Restaurant | 31.81% | 41.26% | 26.94% | 25.35% | 29.80% |
| Retail Goods | 37.85% | 55.59% | 6.56% | 10.60% | 56.41% |
| Transportation | 27.47% | 0.40% | 72.12% | 0.38% | 65.15% |
| Wholesale | 58.80% | 38.50% | 2.70% | 40.21% | 29.19% |
| Overall | 85.97% | 10.73% | 3.30% | 14.83% | 62.55% |
Payment APIs give businesses the ability to embed payment capabilities directly into their websites, apps, or platforms. Across all industries, 85.97% of businesses use a payment API. Adoption is especially high in sectors like Enterprise Utilities (99.92%), Cab/Delivery (99.43%), Health, Beauty, and Wellness (97.13%), and Education (95.42%). If you want full control over the payment experience, APIs are the tool of choice.
eCommerce integrations are ready-made plugins or connectors for platforms like Shopify, WooCommerce, or BigCommerce. These integrations allow you to access merchant services such as multi-method payment processing, payment reporting, chargeback management, and more. Retail Goods leads the way with 55.59% usage, followed by Contractors and Home Services (42.82%) and Restaurants (41.26%).
Accounting integrations help businesses reconcile transactions, track revenue, and streamline financial reporting. Helcim merchants can also integrate with QuickBooks or Xero to take advantage of lower processing rates when sending invoices. While adoption is still limited at 3.30% overall, it's more common in industries like Transportation (72.12%), Wholesale (7.26%), and Retail Goods (6.56%).
Accept payments in-person and online with Helcim
Whether your customers pay at the counter, over the phone, or through your website, Helcim gives you everything you need to accept payments seamlessly—in one platform.
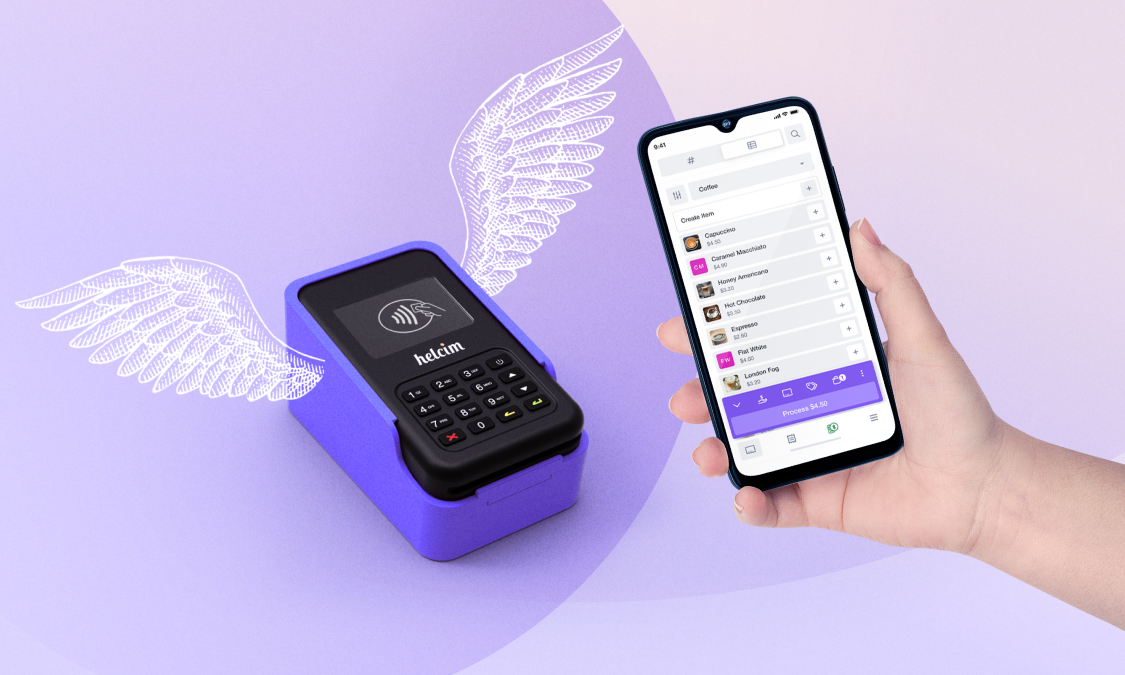
In-person payments: Helcim’s smart terminal, card reader, and Tap to Pay on iPhone let you accept debit, credit, and contactless payments without the bulky setup.
Online payments: From virtual terminals to recurring billing, invoicing, and payment pages, Helcim makes it easy to accept payments no matter how your customers prefer to pay. Whether you send an invoice, every tool is designed to help you get paid—quickly and securely.
You don’t have to juggle different providers or pay hidden fees. With interchange-plus pricing, you get transparent rates and up to 25% savings compared to flat-rate processors.